Understanding the JVM Runtime Memory Areas for Better Garbage Collection

This is the second post in a series about Garbage Collection (GC). If you missed the first part, we introduced what GC is and discussed various GC implementations. Today, we're diving deeper into the fascinating world of the Java Virtual Machine (JVM) to understand its runtime memory areas. After all, you can't master garbage collection without first understanding how memory is organized. Let's get started!
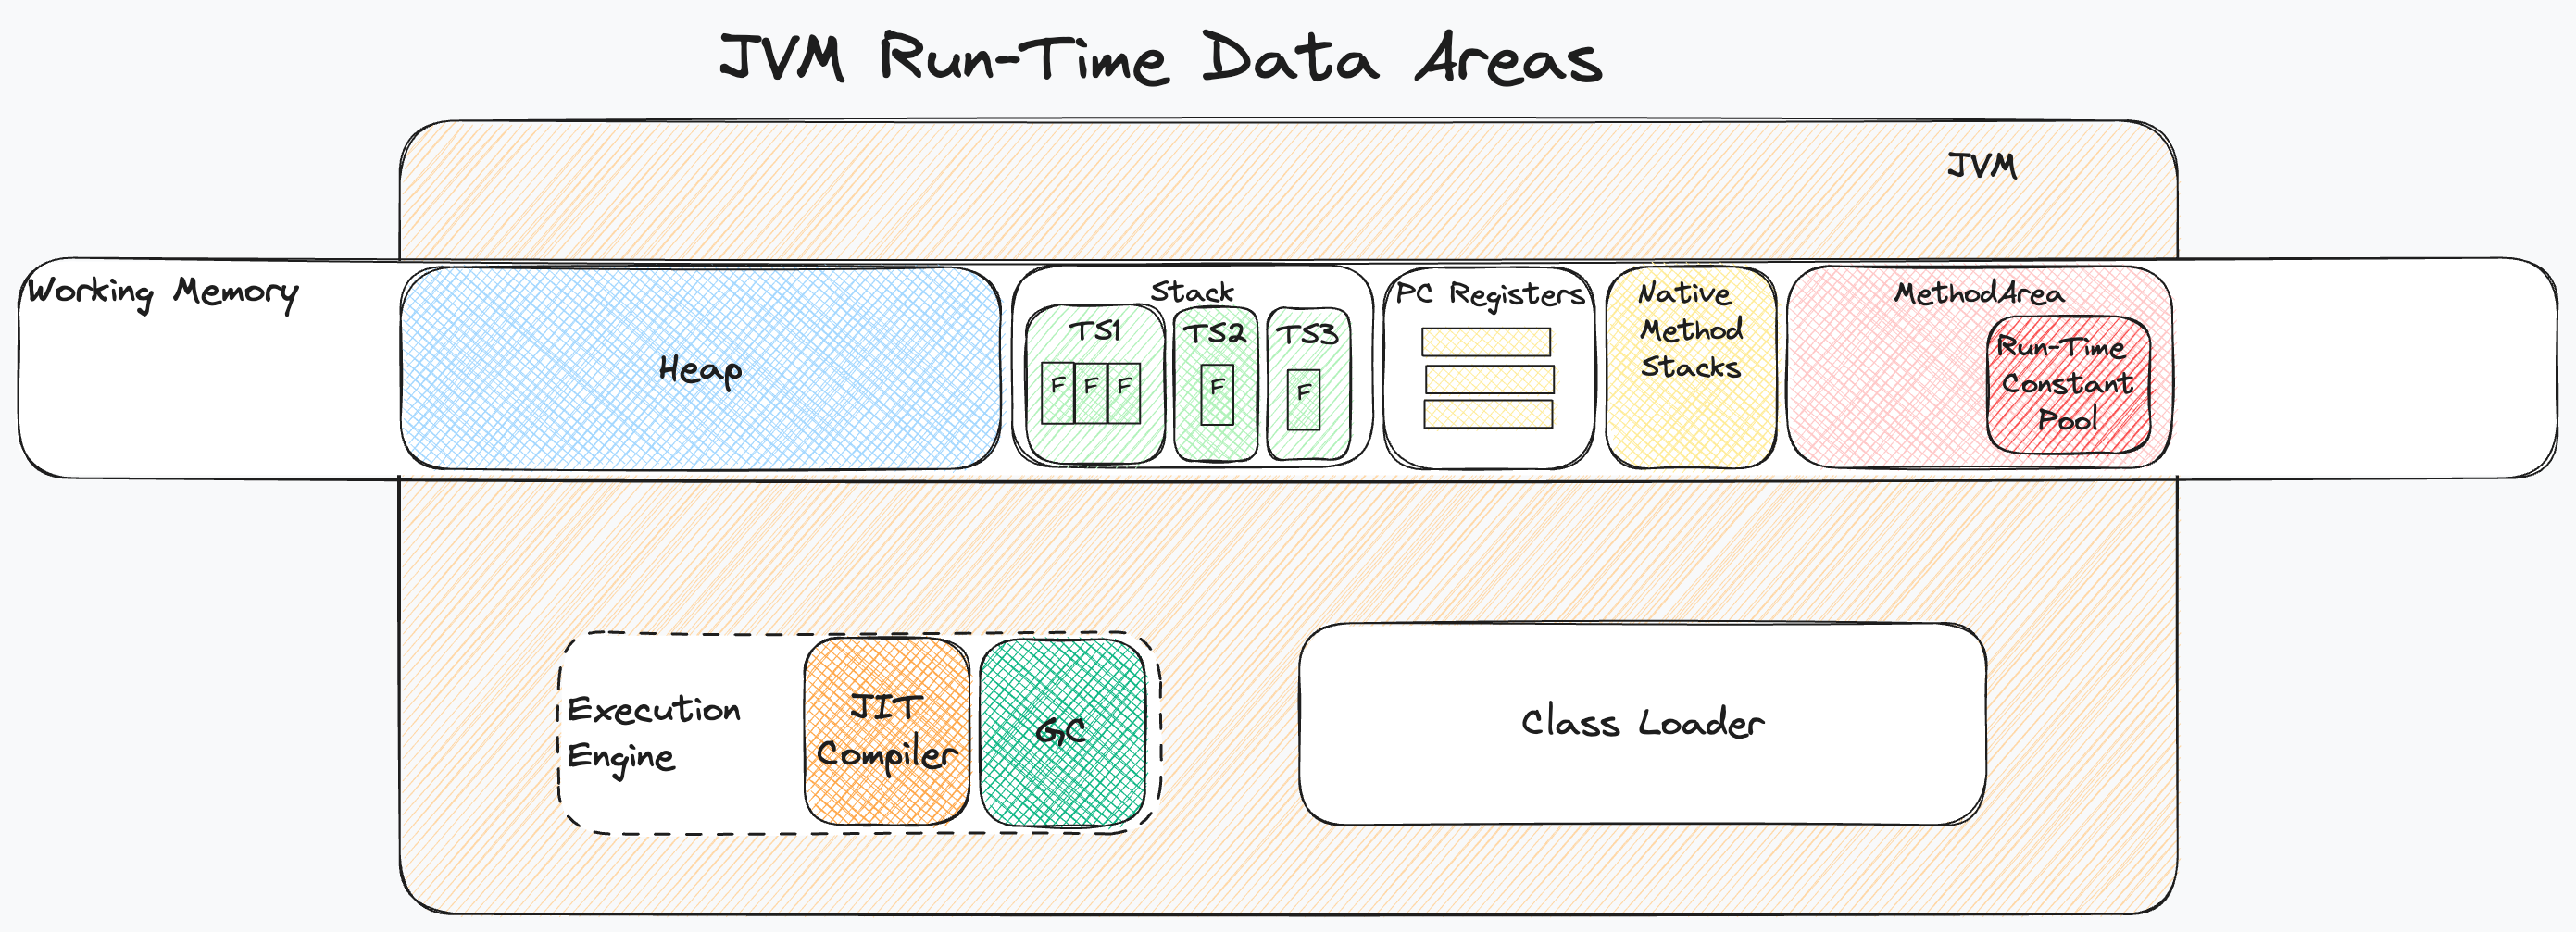
The Main Runtime Data Areas
Let's delve into the key runtime data areas: heap, stack, method area, code cache, PC registers, and native method stacks.
The Stack Area
The Stack area is the memory command centar for each thread in execution. Each thread has its own dedicated stack. Here, frames are dynamically added and removed as methods are called and completed.
Each of the stack frames for a method holds its local variables, operand stack for computations, and a return address to indicate where to resume execution after the method finishes. It may also contain a dynamic link to the calling method's frame for returning control.
The stack area can either be of fixed size or it can be dynamically expanded. Frames can even be heap allocated. It all depends on what options the JVM implementation allows. If a thread exceeds the permitted Java Virtual Machine stack size, a StackOverflowError is thrown. If the JVM stack can't be expanded due to insufficient memory, either during its initial creation for a new thread or during dynamic expansion, an OutOfMemoryError is thrown.
PC Registers
The PC Registers exist to facilitate multithreading. Each thread has its own program counter (pc) register, which points to the current instruction being executed in a single method. If the method is native, the pc register's value is undefined. The pc register can hold a returnAddress or a native pointer based on the platform.
When a thread context switches, the JVM looks at the PC register to determine which instruction to resume with.
Native Method Stacks
If a native method is invoked, its execution will take place on the Native Method Stack. During this time, the PC register corresponding to this method will remain empty. Think of this as the JVM outsourcing some work.
The Heap Area
The heap stores all class instances and arrays created during the execution of an application. It will be the area that takes up most of the space because of that. Given its size and role in object storage, the heap would benefit the most from an automated storage management system. And that is the Garbage Collector. It will automatically remove unused objects and compact the heap memory.
The heap is created when the application starts. Depending on the JVM implementation, it can either be of fixed size or be allowed to dynamically expand and shrink. When the heap runs out of space for new objects, or cannot expand further, the JVM will throw an OutOfMemoryError.
Method Area
This area holds the compiled bytecode and metadata like the runtime constant pool, field data, and method data. It is shared among all threads. Although it's conceptually part of the heap, JVM implementations can choose to separate it. Whether or not it gets garbage collected is also up to the specific JVM implementation.
Run-Time Constant Pool
The run-time constant pool is a logical part of the method area and serves as a repository for class and interface-level constants. This includes everything from numeric literals defined at compile-time to method and field references that are resolved at run-time. It holds representation of all compiled class and interface constant pool tables.
Conclusion and What's Next
We've navigated through the maze of JVM's runtime memory areas, each with its own unique role and behaviour. Understanding these is crucial for anyone keen on mastering garbage collection or optimising Java applications for performance. In the next part of this series, we'll tackle the inner workings of garbage collection algorithms. Stay tuned!
Member discussion