Spring Boot Metrics with Prometheus
I recently needed to do a proof of concept for a web application. One of the requirements was that there had to be an easy way for collecting metrics and monitoring. Thanks to its Actuator, this requirement made Spring Boot a top choice. Not that it wasn’t already.
However, the Actuator on its own is not enough. It just produces data. I also needed a monitoring system to manage and visualize that data. Luckily Spring Bot 2 uses Micrometer as its metrics collection facility. That makes it support multitude of monitoring systems out of the box. Apart from New Relic which is a commercial product I wasn’t really familiar with any of them. Therefore I just picked Prometheus at random.
These are a few quick steps how you can put everything together.
Setting up the Spring Boot application
Spring Boot enables the Prometheus actuator endpoint by default. I only needed to expose it in the application.properties:
management.endpoints.web.exposure.include: prometheus
After this, the endpoint is both enabled and exposed. But it is still not secured. So this is not a production ready setup. You’d probably want to implement some security for that.
I also needed to add the following two dependencies:
<dependency>
    <groupId>org.springframework.boot</groupId>
    <artifactId>spring-boot-starter-actuator</artifactId>
</dependency>
<dependency>
    <groupId>io.micrometer</groupId>
    <artifactId>micrometer-registry-prometheus</artifactId>
</dependency>
This part I found a bit tricky. In all the Spring Boot documentation for the Actuator I didn’t find that I need to add the micrometer-registry-prometheus dependency.
Setting up Prometheus
There is plenty of info on Prometheus’ site how to install and configure it. I found it easy to figure out what lines I needed to add to the configuration file:
scrape_configs:
  - job_name: 'spring-boot'

    scrape_interval: 5s
    metrics_path: '/actuator/prometheus'
    static_configs:
      - targets: ['localhost:8080']
This tells Prometheus what endpoint to use for scraping the metrics data.
Viewing the metrics
If the Actuator is well setup then http://localhost:8080/actuator/prometheus should display a list of all all available metrics.
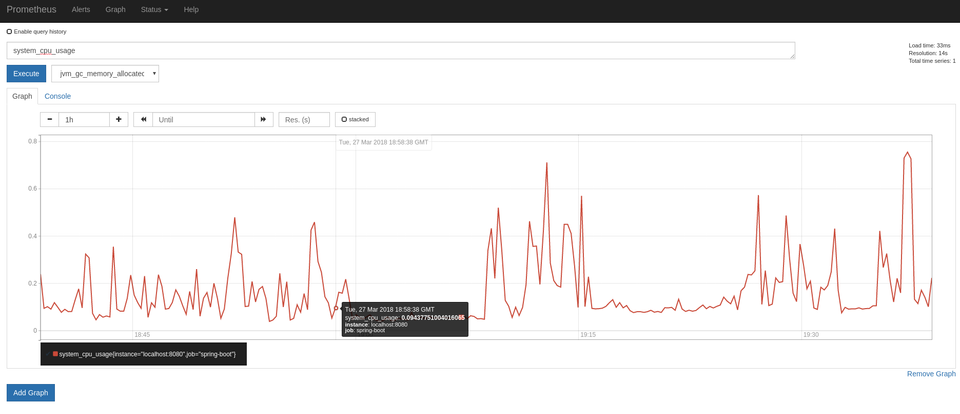
Prometheus default url is http://localhost:9090 which shows a simple graphing utility. All you need to do is to pick the metrics and create the graph.


Versions
The example was created and tested using the following versions:
- Spring Boot 2.0.0
- Prometheus 2.2.1
- OS: Tested on Windows 10 and Fedora 27
Member discussion